|
How STEREO Views the Entire Sun
Starting in February 2011, and continuing on for the next eight years, mankind
now has its
first ever 360 degree view of a star - our own
Sun. By combining images from NASA's
Solar Terrestrial
Relations Observatory
(STEREO) Ahead and Behind spacecraft, together with images from NASA's
Solar Dynamic
Observatory
(SDO) satellite, a complete map of the solar globe can be formed. Previous to
the STEREO mission, astronomers could only see the side of the Sun facing
Earth, and had little knowledge of what happened to solar features after they
rotated out of view. Would active regions grow larger, and affect the space
weather environment when they rotated back again two weeks later, or would they
decay away? What about new active regions forming on the far side of the Sun,
waiting to surprise us? With STEREO's 360 degree view of the entire Sun, that
will no longer happen.
 |
|
Rotating solar globe combining images from the STEREO-Ahead, STEREO-Behind, and
SDO, taken on 4 January 2011 in the Helium II emission line at 304 Angstroms.
The small black wedge on the far side of the Sun was filled in starting
February 2011.
|
This movie
shows the wedge closing between February and June 2011 as STEREO A and B moved
further towards the farside of the Sun.
STEREO's Orbit
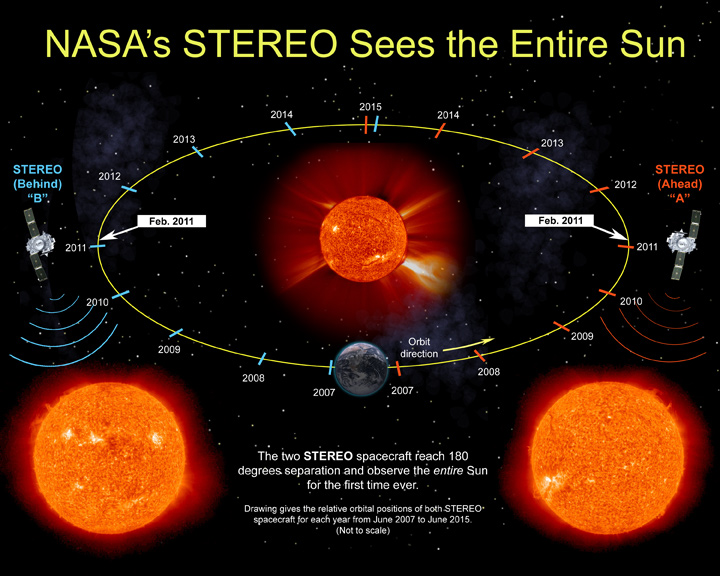
STEREO is able to accomplish this feat because of the unique orbits of its two
spacecraft. Each spacecraft is in its own orbit about the Sun (a
heliocentric orbit) with orbital parameters that differ just slightly from
those of Earth. It's these slight differences that make all the difference. The
STEREO-Ahead spacecraft has an orbit that is a little bit closer to the Sun than
Earth, and therefore orbits a little bit faster. STEREO-Behind, on the other hand, has
an orbit just slightly outside Earth's, and is thus a little bit slower. The end
result is that each spacecraft seems to slowly drift in opposite directions away from
Earth by about 22 degrees per year, as illustrated below.
Although, as seen from Earth, the two spacecraft seem to be going in opposite
directions, they're really going in the same direction, just at different
speeds. This
movie
shows the STEREO orbits as they would be seen by a hypothetical observer above
the solar system. The green dot represents Earth, and the red "A" and blue "B"
represent the STEREO "Ahead" and "Behind" spacecraft respectively. The yellow
dot represents the Sun. The orbits of Mercury, Venus, and Mars are also shown.
Note that the orbits of the two STEREO spacecraft differ not only in their
orbital distances, but also by how much that distance varies over the orbit.
This property is described by a parameter known as the orbital
eccentricity, denoted with the symbol e. A perfectly
circular orbit would have e=0. STEREO-Ahead's orbit is very close to
circular, with e=0.006, while that of STEREO-Behind is more eccentric
(e=0.042). The eccentricity of Earth's orbit falls somewhere in
between (e=0.017).
STEREO Orbital Insertion
Getting the STEREO spacecraft into orbit around the Sun was not simple. It
involved using the Moon's gravity to "slingshot" the spacecraft in their proper
orbits. Both spacecraft were originally launched together on a single Delta II
rocket on 26 October 2006. Immediately after launch they are placed into
highly elliptical orbits that range from just a few hundred kilometers above
Earth's surface out to a little beyond the distance of the Moon. Over the next
few weeks the two spacecraft slowly separated from each other, and the Mission
Operations carefully adjusted the orbits of each to line them up for when both
flew by the Moon a few minutes apart on 15 December 2006. The Moon's gravity
grabbed both spacecraft, and flung STEREO-Ahead completely away from Earth into
its orbit about the Sun. STEREO-Behind was also flung out, but not completely,
and came back to swing by the Moon again on 21 January 2007, when it was then
completely flung away in the opposite direction into its own orbit about the
Sun. These motions are demonstrated in this
movie
where the green and grey dots represent Earth and the Moon respectively, and
the red "A" and blue "B" represent the STEREO "Ahead" and "Behind" spacecraft
as before.
How the images are combined
The first step in making a map of the solar globe is to find two STEREO images
taken at the same time and in the same wavelength. This is fairly simple,
because the observing schedules of the two spacecraft are coordinated so that
both should be doing the same thing at the same time. There are a couple of
small effects, however, that need to be taken into account. Since the
STEREO-Ahead spacecraft orbits closer in, light from the Sun reaches
it earlier than it reaches STEREO-Behind. This is taken into account by
delaying the STEREO-Behind images by an appropriate amount so that we are
imaging the same moment on the Sun. Depending on
where the two spacecraft are in their orbits, this delay can be anything from a
few seconds up to as much as a minute. However, the amount of delay is known,
and it's quite simple to match the images from one spacecraft with the other.
The other effect that needs to be taken into account is that the amount of
available telemetry for each spacecraft varies from day to day depending on the
scheduling of the ground stations. Thus, on any given day, one spacecraft
might be able to take more images than the other. However, this is taken into
account in the scheduling so that there's always a subset of images that are
coordinated between the spacecraft.
Next, the position on the solar surface of each pixel in the image is computed.
To do this, we need to know both where each spacecraft is, and how it is
pointed. The position of each STEREO spacecraft over time is carefully tracked
by the NASA Flight Dynamics Facility. A number of different coordinate systems
are used for tracking spacecraft in the solar system, but the easiest to
describe is the ecliptic system. The ecliptic plane is defined as
containing Earth's orbit, and the two STEREO spacecraft also orbit close to
this plane, with only slight inclinations (0.13 degrees for STEREO-Ahead, and
0.29 degrees for STEREO-Behind). Thus, we can describe the position of each
spacecraft by how far along it is in its orbit (the ecliptic longitude), how
much it's above or below the ecliptic plane (the ecliptic latitude), and
by how far away it is from the Sun.
However, what we really want to know is where each spacecraft is relative to
the Sun's own coordinate system, known as heliographic coordinates.
Like other astronomical bodies, the Sun has a rotational axis with a north pole
and a south pole. This rotational axis is inclined by about 7.3 degrees to the
ecliptic axis, so that part of the year we see the Sun's north pole tilted
toward us, and sometimes the south pole. From the orbital position of each
spacecraft, we can calculate where it is in heliographic longitude and
latitude.
 |
|
Image from STEREO-Ahead with lines of constant heliographic longitude and
latitude overplotted.
|
We also need to know the pointing of the spacecraft at the time of the
observation. This can be described as the position of Sun center in the image,
and also by the orientation of solar axis in the image, known as the roll
angle. In the above image, one can see that the solar axis is not quite
straight up-and-down. This is because the STEREO spacecraft are oriented to
keep their high gain antennas pointed toward Earth, effectively maintaining a
constant roll of about 0 in the ecliptic coordinate system. Thus, the solar
axis can be off by as much as +/- 7.2 degrees from straight up-and-down. (The
browse images on the STEREO website have been corrected for roll.) Like the
orbital position, the orientation of the spacecraft as a function of time, both
in terms of the pointing and the roll, is also carefully tracked.
After the coordinates of the STEREO images have been determined, the images are
converted into heliographic maps such as in the examples below. Only pixels
that are inside of the disk of the sun are used, since unique heliographic
coordinates cannot be calculated above the limb (the term used to refer
to edge of the Sun's disk). This would be fine if all the
emission was coming from the surface, but it's clear from the above image that
the Sun has an atmosphere (called the corona) which extends well above
the surface. Vertical features at points near the limb will tend to be
projected nearer to the limb than their actual heliographic position. In the
heliographic maps this shows up as smearing near the edges of the map;
this is expected.
 |
|
Image from STEREO-Ahead converted into a heliographic map.
Zero longitude represents the direction towards Earth.
|
Adding in SDO images
If we only had the STEREO images, we'd have a good view of the far side of the
Sun after February 2011, but would start to lose the parts of the globe on the
side facing Earth. Fortunately, we can fill this part of the Sun with images
from the SDO satellite. SDO observes the Sun in three of the four wavelengths
seen by STEREO: in the Helium II emission line at 304 Angstroms, representative
of plasma at about 80,000 degrees, the Iron IX line at 171 Angstroms (1.3
million degrees), and the Iron XII line at 195 Angstroms (1.6 million degrees).
SDO does not have a bandpass equivalent to the Iron XV line at 284 Angstroms (2
million degrees) seen by STEREO, but the slightly cooler Iron XIV line at 211
Angstroms is a reasonable substitute.
SDO images are not taken at exactly the same time as the STEREO images, but the
SDO cadences are so high one can usually expect to find an image at the right
wavelength within a few seconds of the STEREO observation. Occasionally this
is not the case; for example there are calibration periods when suitable data
are unavailable. In such cases the nearest SDO image is found, and a
correction is made for the solar rotation. The Sun rotates about once every 25
days (sidereal rate). However, because the Sun is gaseous and not a
solid body, the rotation rate is not constant; it varies as a function of
latitude. This is known as differential rotation. Also, because the
spacecraft are also orbiting about the Sun as it rotates, the apparent rotation
rate is somewhat lower (synodic rate), about 27 days. When the SDO
images are corrected for rotation, both of these effects are taken into
account.
The same procedure applied to the STEREO images are also applied to the SDO
image, resulting in three heliographic maps which are then combined to make a
single map. Where the maps overlap, the one where the observation is closest
to solar disk center is used; this minimizes the effect of smearing at
the map edges. Also, since the SDO telescopes are not identical to those on
STEREO, the brightnesses is not be exactly the same, so adjustment factors
are applied to the SDO maps to better blend in with the STEREO maps.
 |
|
Heliographic map made with combined data from STEREO-Ahead, STEREO-Behind and SDO from Dec. 30, 2011.
|
Converting the maps back into a globe
Once a combined heliographic map is obtained, we can then reproject this back
into a three-dimensional globe viewable from any arbitrary direction, using
essentially the inverse of the processed used for making the maps in the first
place. Of course only the solar surace is modeled, not the coronal emission
above the limb, so it's not quite a true three-dimensional representation. In
the rotating globe movie above, a series of 36 back projections were made,
rotated by 10 degrees of longitude between each step, to give a full 360 degree
view.
Completeness
The separation between the STEREO Ahead and Behind spacecraft exceeded 180
degrees on 6 February 2011. On this date the two spacecraft viewed the Sun from
completely opposite directions, thus viewing the entire Sun. After that date,
the spacecraft started to approach each other on the far side of the Sun, and SDO
data were needed to fill in the Earth-facing side that STEREO no longer
sees.
Although one can say with honesty that the entire Sun was seen after 6 February
2011, a small gap still persisted in the heliographic maps for several days
after this. This effect is due to perspective. From a distance of about 150
million kilometers one does not see exactly one half of
the mathematical solar surface. Instead, the solar horizon is be
slightly smaller than 90 degrees away from Sun center. This is really a
limitation in the way that the heliographic maps are formed, because the solar
emission is not coming from a mathmatically flat surface, but from an extended
atmosphere with thickness above that theoretical surface. In the images,
emission from this part of the Sun is seen above the limb, but that observed
emission does not show up in the maps. The gap in the maps gradually
disappeared over the next several days, starting in the northern hemisphere, and
was be essentially gone by 12 February 2011, although some remnant
persisted in the regions near the poles.
Last Revised: Wednesday, 03-Sep-2025 19:43:27 UTC
Responsible NASA Official: ![[email address: Therese.A.Kucera<at>nasa<dot>gov]](/img/kucera_email1.jpg)
Accessibility
Privacy Policy and Important Notices
Feedback and comments: webmaster
|