EUVI Pointing Correction 2013/06/07
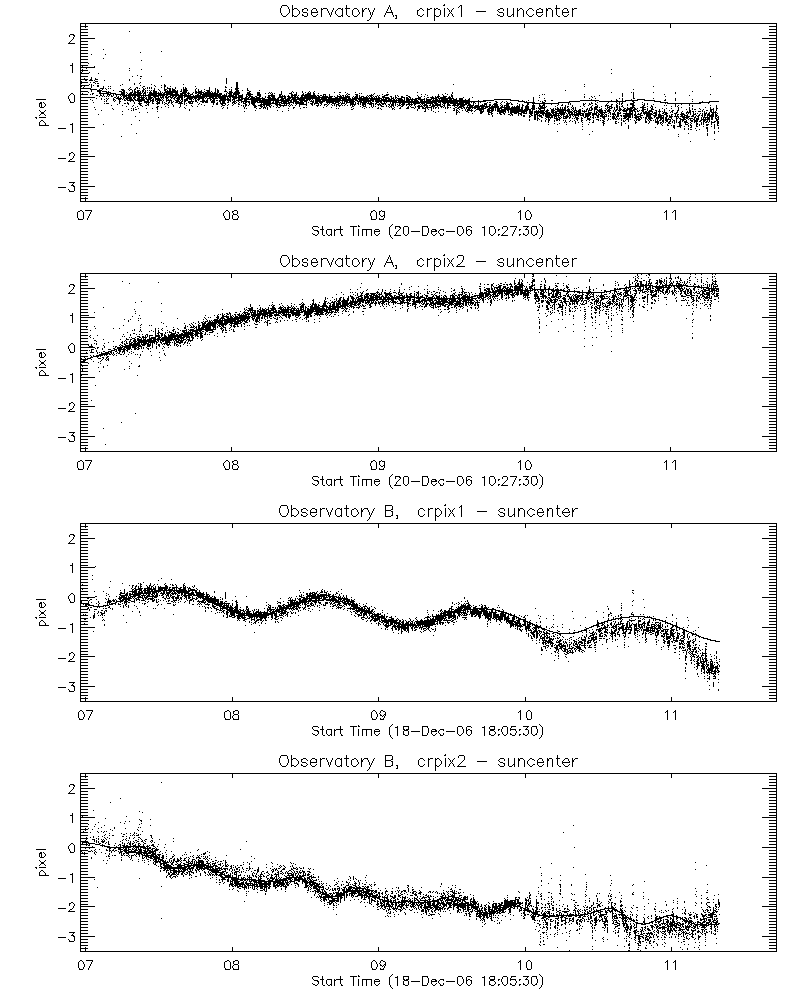
CRPI Xi is specification of the sun center in the FITS header. The true suncenter was determined by an automatic limb finder algorithm. The solid line is a best fit function that could be used to predict future drifts. It also has a periodic component with the fundamental and the first harmonic of the SC orbital period. Back then [2010] I promised we would correct the EUVI FITS headers, but this hasn't happened yet.
Part of the problem is that the cause is most likely a combination of two things:
1. A thermally induced drift between the GT and the EUVI
2. A thermally induced error in the GT that is more or less proportional to the GT offpoint bias.
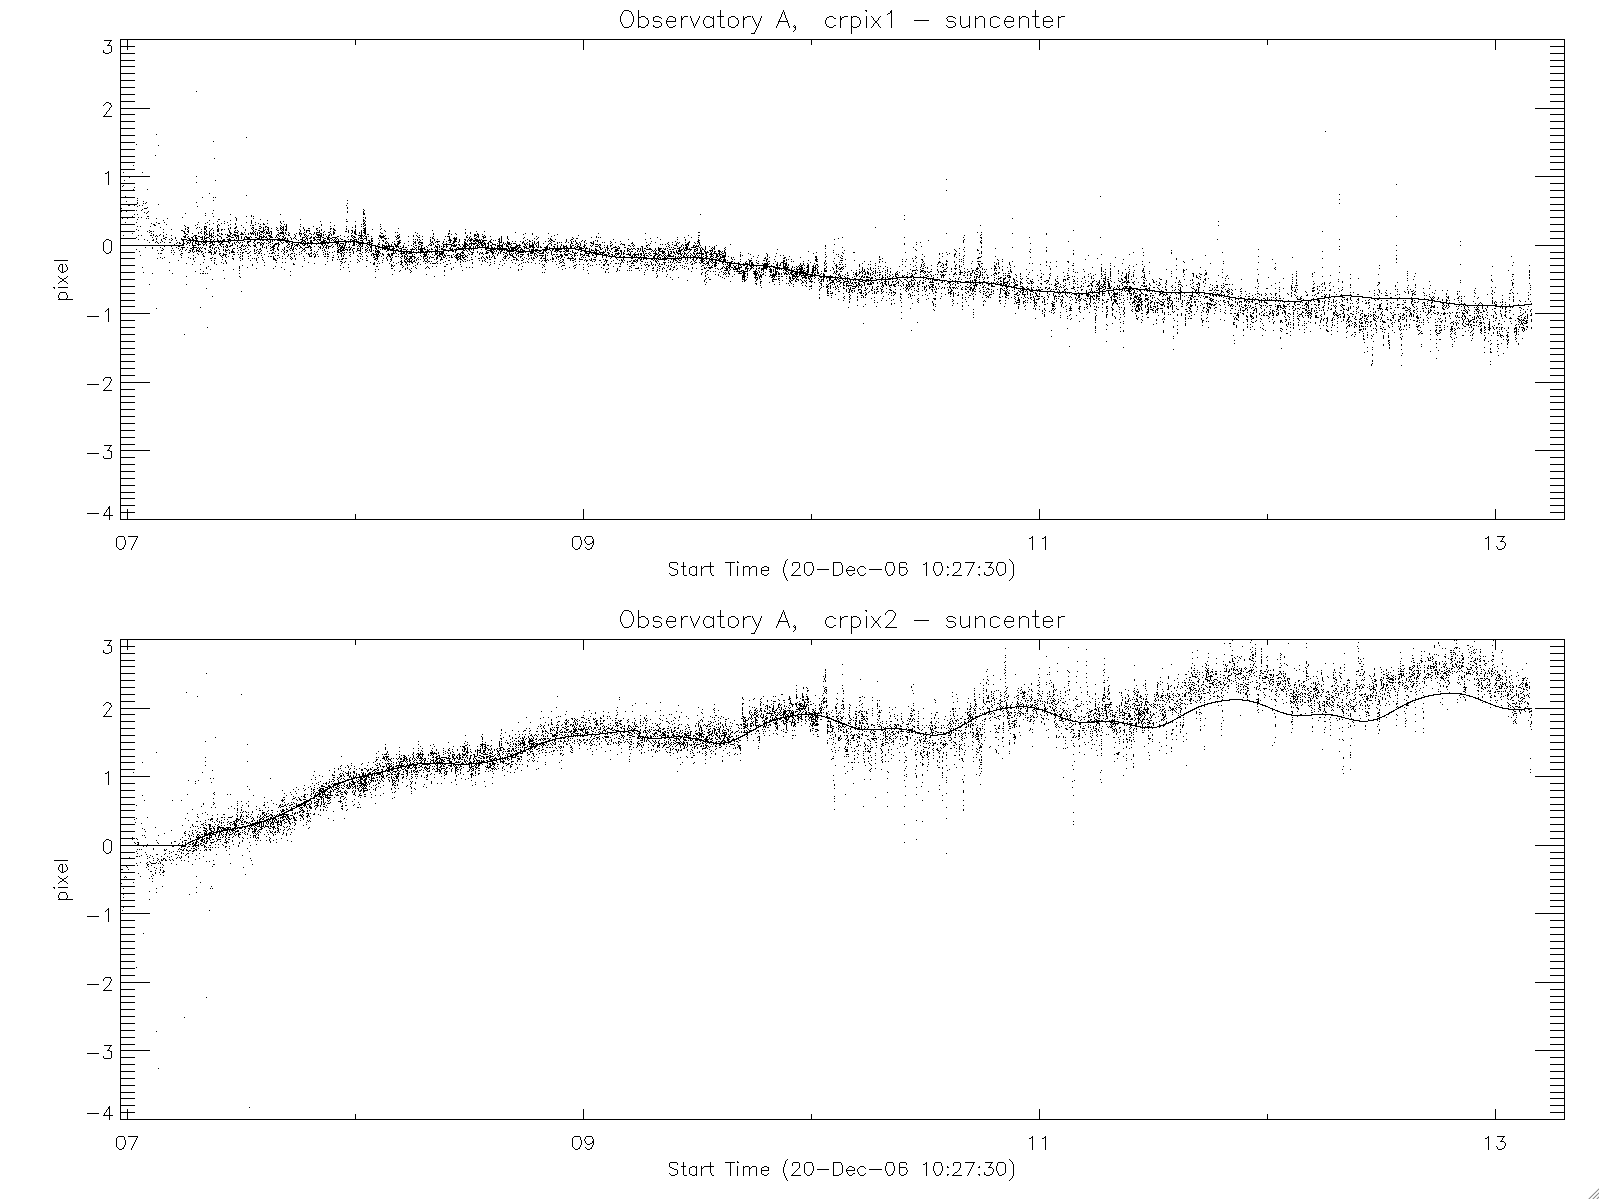
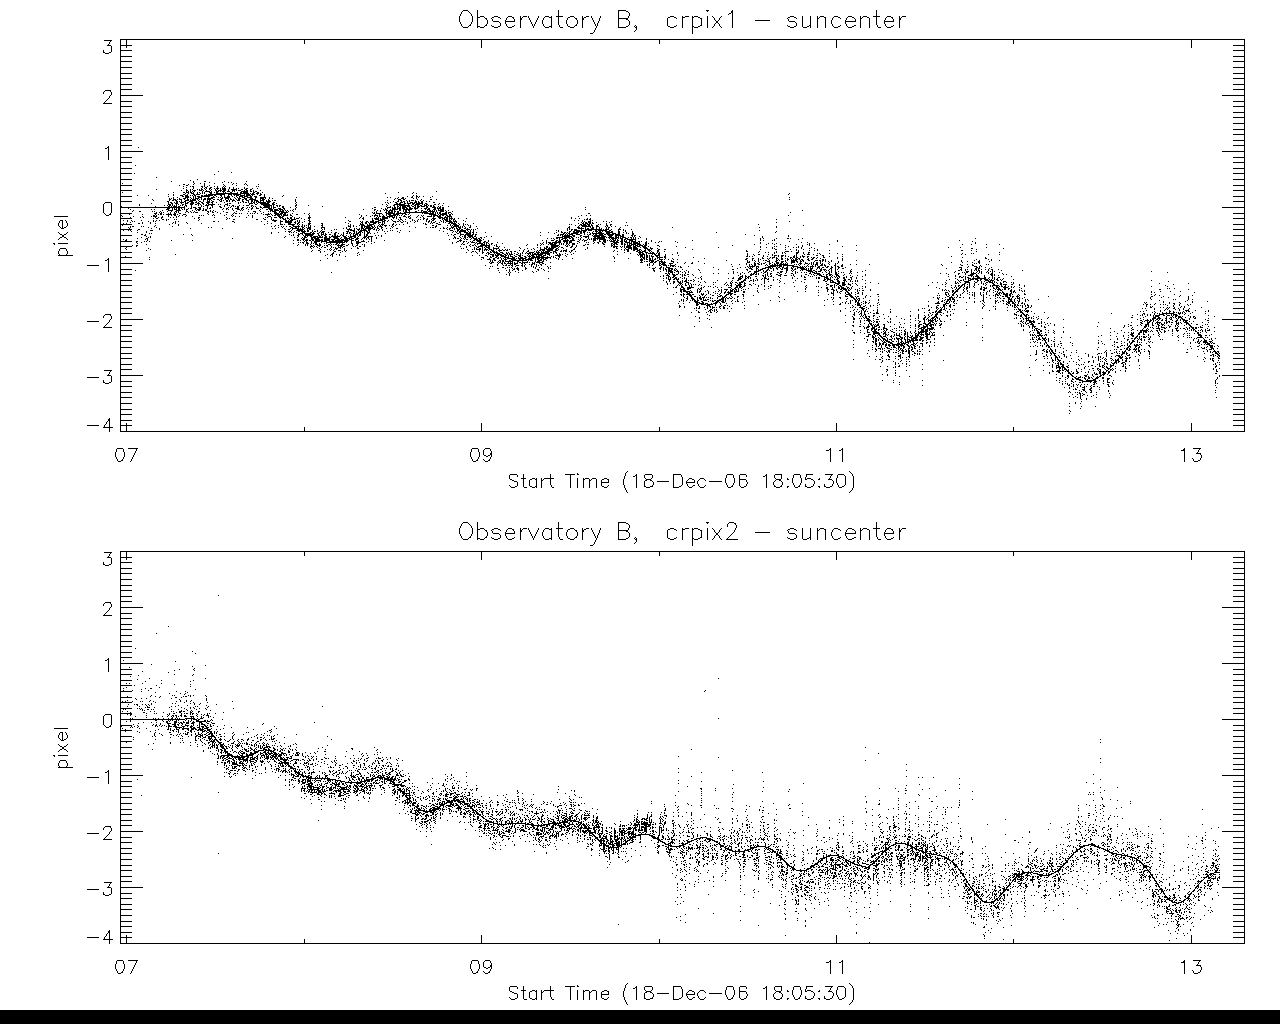
A new pointing correction has been implemented in EUVI_POINT.PRO, on by default in SECCHI_PREP. The following plots pertain to the correction in euvi_point.pro,v 1.17 2013/06/07 20:43:34.
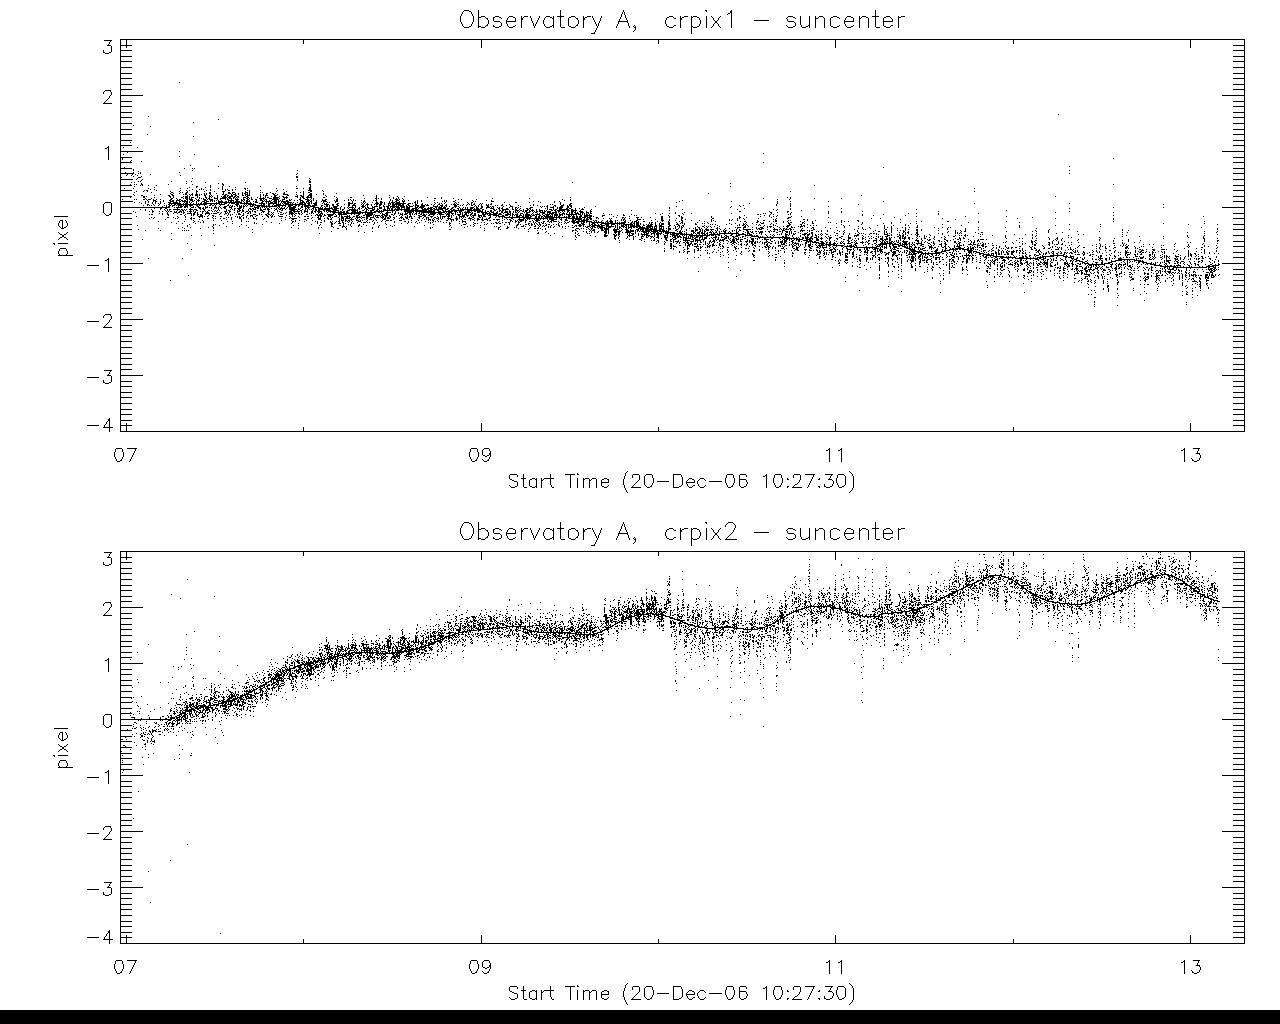
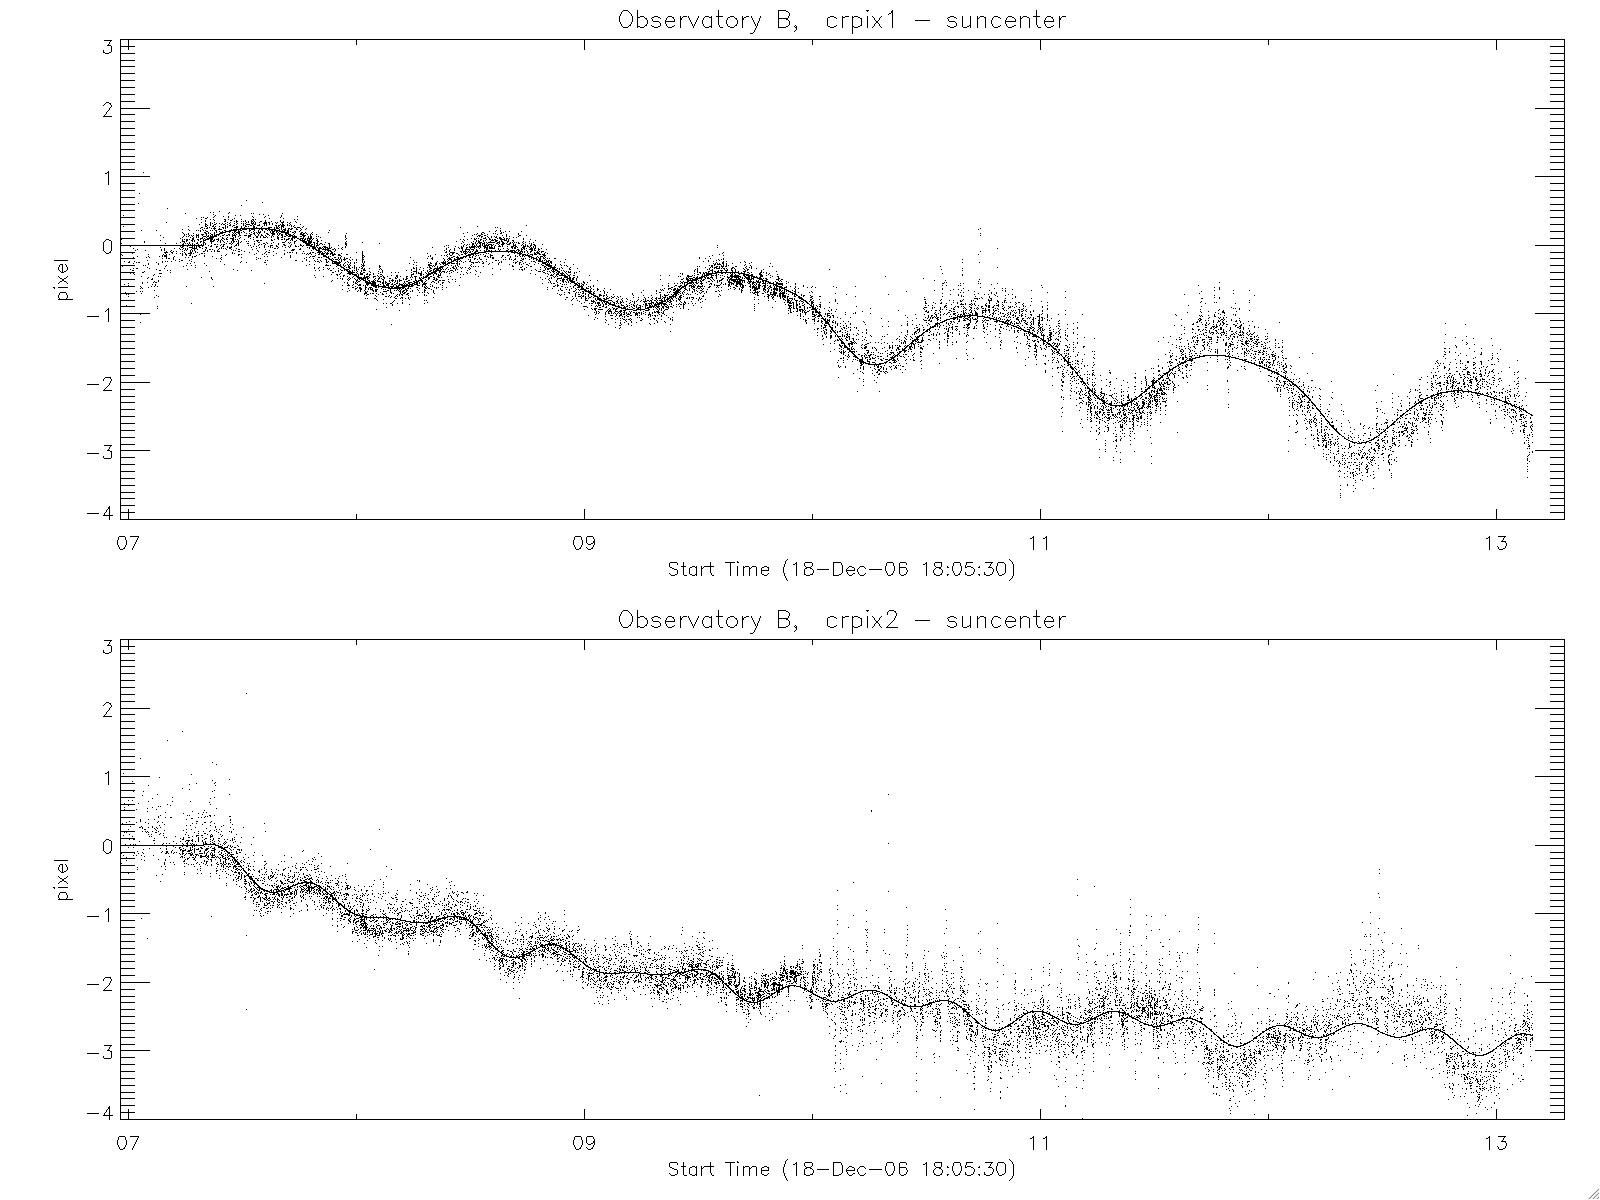
The first two attached figures show the measured pointing drifts (dots), and the pointing drift correction that this version of euvi_point applies. It will naturally extrapolate into the future when used in the pipeline, so it won't be perfect there. I tested its predictive performance by only fitting data up to June 2011, and then plotting that fit on top of the drift measurements until March 2013 (last two figures attached). You can see it does a fairly decent job on Behind, and a bit less so on Ahead. Even there it is not more than about 0.5 pixels off after 21 months on autopilot.
 Observatory A
 Observatory A
 Observatory B
 Observatory B
Historical EUVI Pointing Analysis
Comparison of EUVI CRPI Xi versus true sun center: (from Jean-Pierre Wuelser, 2011/05/05). The first plot shows the trend from launch to the end of April 2011, with the current best fit correction shown as a solid line. (EUVI platescale = 1.6 arcsec/pixel)
 Launch to end of April 2011
The second plot shows the same trend, but the correction was the best fit as of two years ago. It shows how well or poorly the correction predicts the future (in this case May 2009 - April 2011). It is not too bad, but the correction will have to be updated periodically, and retroactively.
 Adjusted prediction from May 2009 - April 2011
I tried to find out whether plate scale changes in the GT, together with the rather large pointing bias may have contributed to the trend. There were indeed plate scale changes, and they seem to explain some, but certainly not all, of the trends. This may not be a very important issue since we are unlikely to permanently change the pointing bias at this point in the mission. A clear answer may have shed some light onto the question whether Cor1 sees the same pointing trend. I don't think there is a clear answer at this point, although I would expect that it sees a portion of the same trends as the EUVI. Note that the trend is not very large, less than 3 EUVI pixels peak-to-valley, or less than 5 arcsec, so it may be hard to measure with a 7.5 or 15 arcsec (binned) Cor1 pixel.